Profitability Factors Lost as Much as 62%
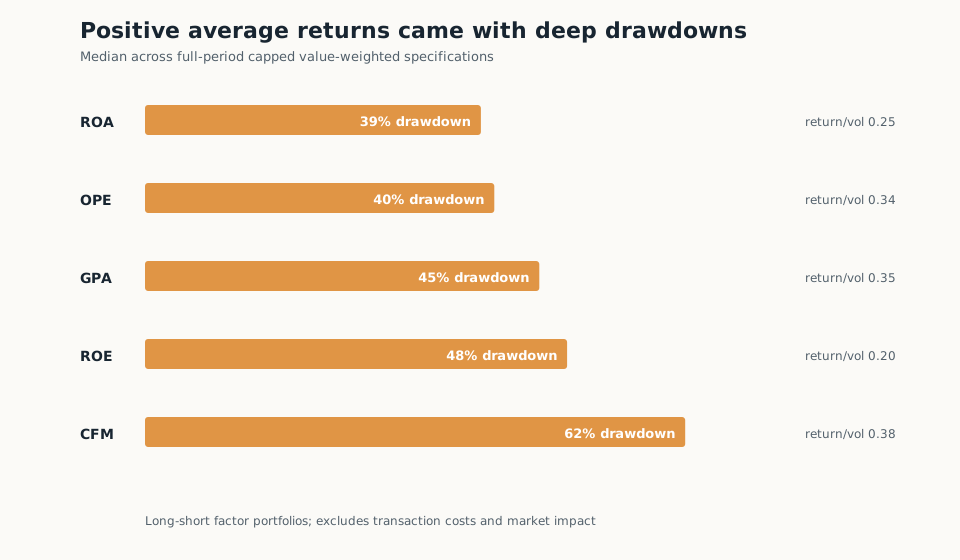
Positive full-history returns across five profitability measures came with median drawdowns ranging from 39% to 62%.
Factor returns are usually quoted as annualized averages taken over decades. This article adds the loss record: the maximum drawdowns of five profitability factors that all finished 1960–2024 with positive median returns. Each spent part of that history at least 39% below a prior peak, and the factor with the best lifetime return fell furthest, near 62%. Evaluating a profitability strategy requires both numbers.
Cash-flow-to-market produced the strongest lifetime return in a five-factor profitability sweep and the deepest loss from a prior peak. Its capped value-weighted series earned a median 4.5% a year over the full history while suffering a median maximum drawdown of about 62%.
The other measures offered limited relief. Gross profitability paired a 3.2% median annual return with a 45% drawdown. Operating profitability returned 2.7% with a 40% drawdown. Return on assets had the shallowest median loss at roughly 39%, still large enough to dominate years of average premium.
Average return compresses the order of gains and losses. Maximum drawdown restores one piece of that path by measuring the largest fall from a prior wealth peak to a later trough. It leaves out the duration of the decline, the speed of recovery and whether an investor could have maintained the position.
The loss profile also complicates the idea that a long-short portfolio removes broad market risk. Buying companies with high profitability and shorting those with low profitability can reduce some market exposure. The two sides can still differ by valuation, sector, size, financing and sensitivity to the economic cycle. Those exposures can move together when the market rotates.
Weighting and sorting decisions add another layer. Equal weighting gives smaller companies more influence. Value weighting concentrates the result in larger names. Capped value weighting limits that concentration without eliminating it. More portfolios isolate more extreme tails, raising the potential spread and narrowing the group that produces it.
The return-to-volatility ratios remained modest across the sample. Median capped value-weighted ratios ran from about 0.20 for return on equity to 0.38 for cash-flow-to-market, before transaction costs and market impact. A positive premium over several decades coexisted with a path capable of breaching leverage limits, risk budgets and investor patience.
Business quality can remain intact during those losses. Valuation multiples can compress even as profits hold. A crowded quality cohort can unwind. Weak companies in the short portfolio can rally as financing conditions ease. The historical series combine those effects with the accounting signal, leaving the return path exposed to more than operating performance.
That separation matters for long-only products as well. Profitability can guide company selection while position caps, size tilts, rebalance buffers and turnover controls determine how the idea enters a portfolio. Valuation and balance-sheet tests address risks that a profitability measure does not capture.
The five factors finished their full histories with positive median returns. Investors following the paths would have faced losses approaching half their capital in four of them and nearly two-thirds in the fifth. Durability in the accounting measure offered no shortcut around portfolio risk.
Sources
- Tidy Finance Factor Library, U.S. long-short portfolio returns derived from CRSP and Compustat, 1960–2024.
- The Tip Desk factor-library pilot: median full-period results across capped value-weighted ROA, ROE, gross-profitability, operating-profitability and cash-flow-to-market specifications.